Structural Memory Leaks: Binary Outcomes in Coarse-Grained Reclamation
Proven binary outcome for coarse-grained allocators: drainability yields O(1) retention, violations cause Ω(t) growth. Detect structural leaks with sub-2ns overhead using libdrainprof.
- categories
- Debugging Performance Systems
- published
📚 Series: Structural Leaks
- Structural Memory Leaks: Binary Outcomes in Coarse-Grained Reclamation (current)
- Catching Structural Memory Leaks: A Temporal-Slab Case Study
- Instrumenting Redis for Structural Leak Detection: A jemalloc Deep Dive
Your service has been running for three days. Memory usage climbed from 2GB to 18GB. You suspect a leak. You run Valgrind. Zero leaks detected. You run AddressSanitizer. Clean. You add logging to every allocation and deallocation. Everything that’s allocated gets freed.
So where did 16GB go?
This is the symptom of a structural memory leak - a class of memory bug that traditional leak detectors cannot see because they only track individual objects, not the coarse-grained containers that hold them.
Research Result: I proved coarse-grained allocators have a binary asymptotic outcome:
- Satisfy drainability → O(1) retention (memory plateaus)
- Violate drainability → Ω(t) retention (unbounded linear growth)
No middle ground. No tuning helps. The routing function alone determines which class you’re in.
Paper: Drainability: When Coarse-Grained Memory Reclamation Produces Bounded Retention (Blackwell, 2026)
The Binary Outcome
Same allocator. Same workload. Only the routing function changed:
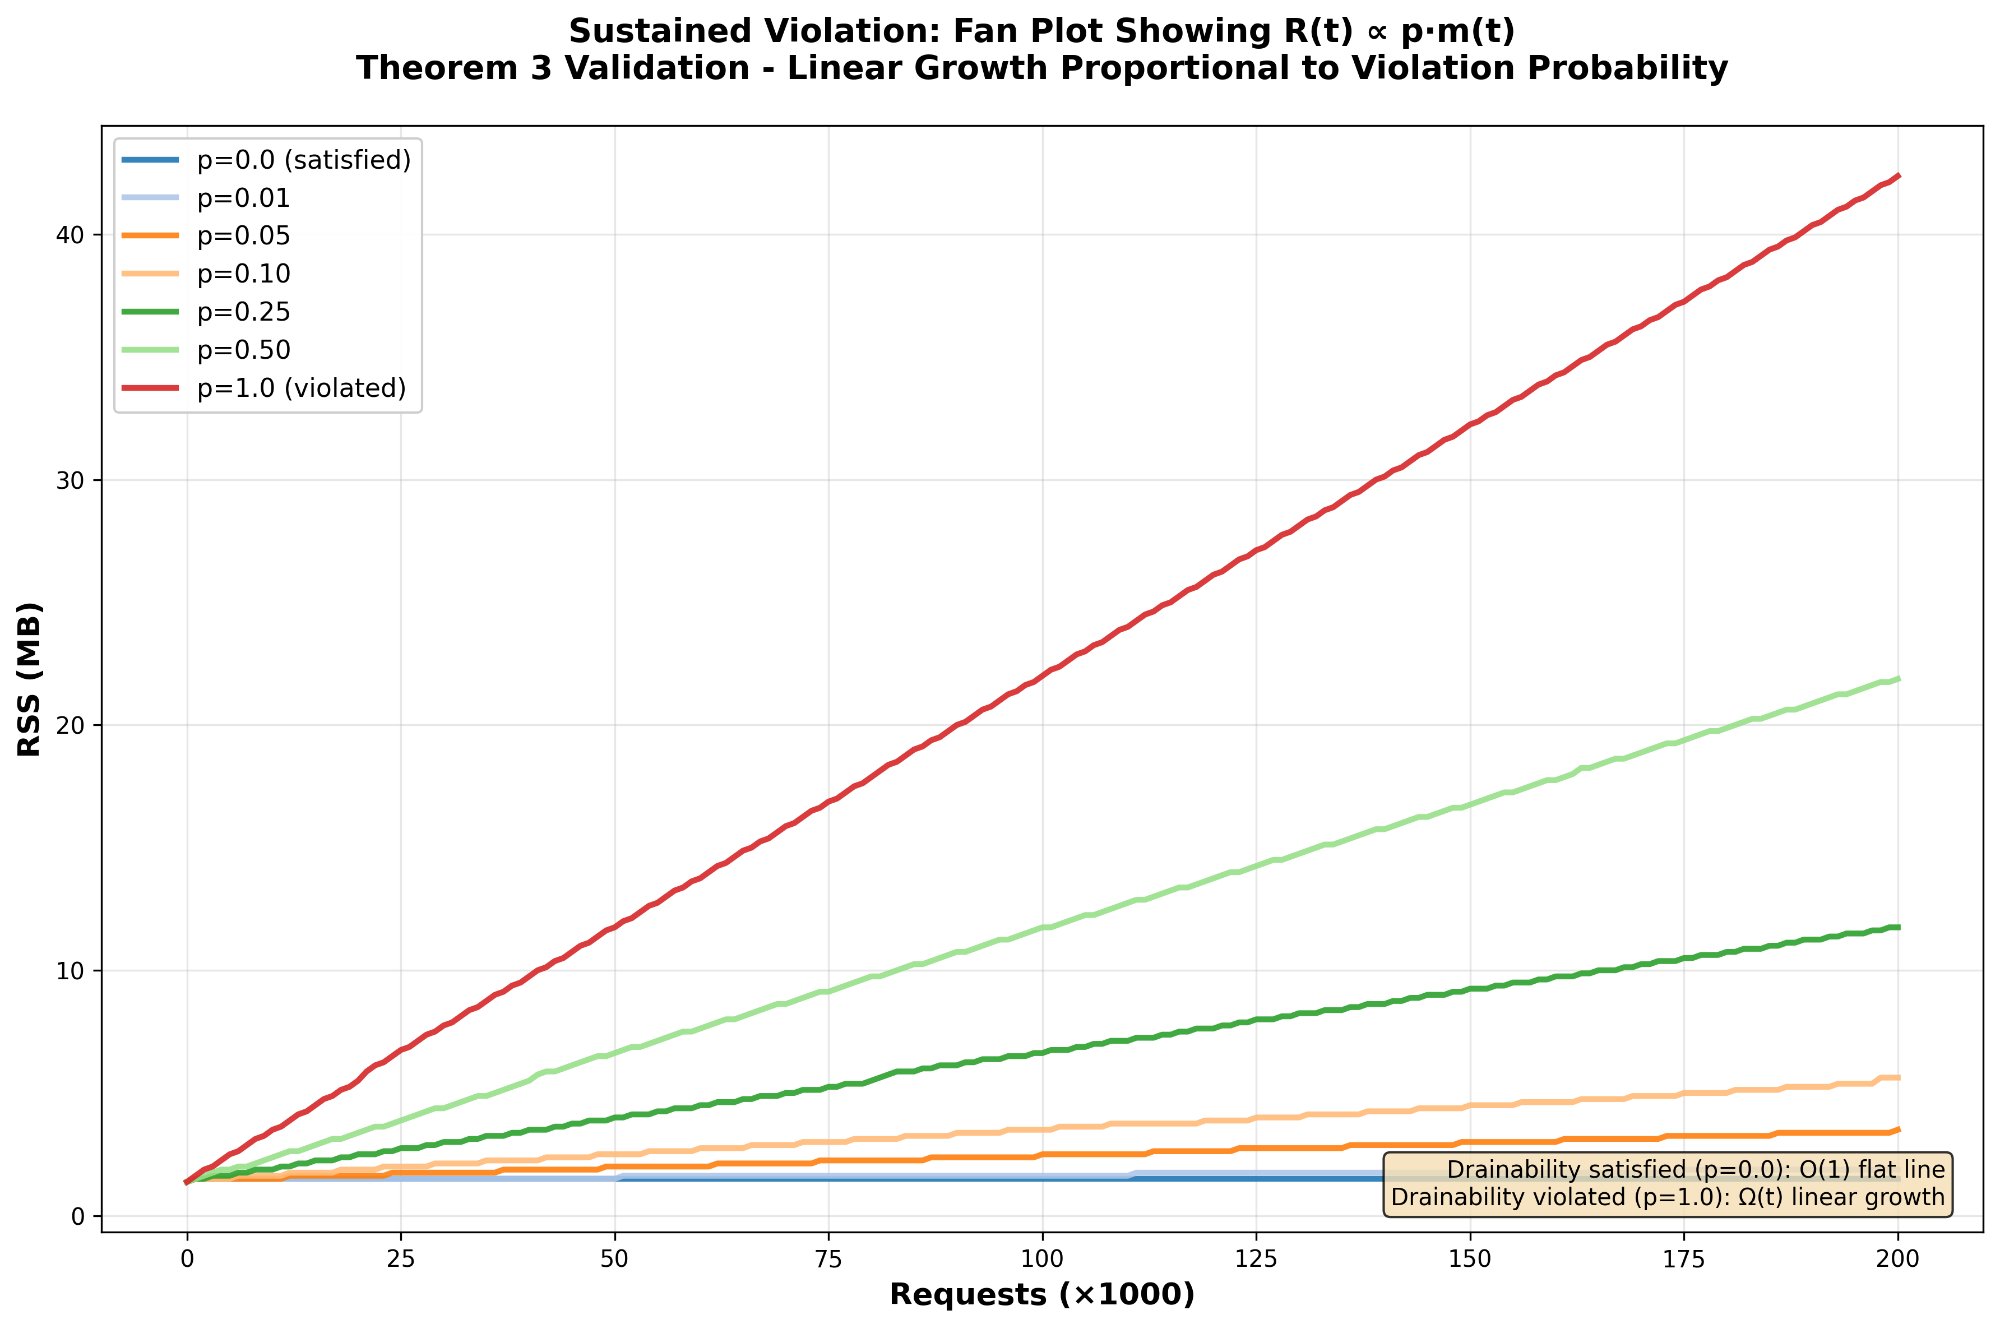
What you’re seeing: Seven different violation rates (p = 0.0 to 1.0). The p=0 line plateaus at O(1). Everything else diverges linearly at Ω(t). Even small violation rates cause unbounded growth in long-running services.
This isn’t fragmentation (different problem). This isn’t tuning (wrong tool). This is a structural property with a sharp asymptotic boundary - the routing function alone determines which class you’re in.
What Are Structural Leaks?
Consider a slab allocator with 1,000 slots per slab. Your service allocates 1,000 objects in slab #47. Over time, 999 of those objects are freed. But one remains - a session object that won’t be freed for another hour.
Valgrind sees no leak. That one object is still reachable, still in use. But the allocator can’t return slab #47 to the OS. It’s pinned by a single allocation. The memory backing those 999 freed slots is gone but not reclaimable.
Multiply this pattern across thousands of slabs, epochs, or arenas over days of uptime, and you get unbounded memory growth with zero reported leaks.
16KB blocked by 1 object] style slab fill:#3A4A5C,stroke:#6b7280,color:#f0f0f0 style slot1000 fill:#C24F54,stroke:#6b7280,color:#f0f0f0 style result fill:#4C3A3C,stroke:#6b7280,color:#f0f0f0
Why Coarse-Grained Allocators?
Many high-performance systems use coarse-grained memory management:
- Epoch-based allocators: Allocate from epoch N, advance to N+1, reclaim epoch N when safe
- Arena allocators: Bulk allocation per request/connection, bulk free when done
- Slab allocators: Pre-allocated pools of fixed-size objects
- Region allocators: Grouped allocations with lifetime boundaries
These allocators trade fine-grained control for performance. But they share a property: memory is reclaimed at granule boundaries (epochs, arenas, slabs), not per-object. If one allocation outlives the granule’s intended lifetime, the entire granule is retained.
Introducing Drainability
The property we need to measure is called drainability - whether a granule can be reclaimed at its natural boundary.
Drainable granule: All allocations freed by the time the granule closes. Memory is reclaimable.
Pinned granule: At least one allocation still live when the granule closes. Memory is retained despite most objects being freed.
The metric that quantifies this is the DSR (Drainability Satisfaction Rate):
DSR = drainable_closes / total_closes
- DSR = 1.0 (100%): Perfect drainability. All granules reclaimed.
- DSR = 0.5 (50%): Half of granules pinned by lingering allocations.
- DSR = 0.0 (0%): Every granule has pinned allocations. Severe structural leak.
The Tool: libdrainprof
libdrainprof is a C library that instruments coarse-grained allocators to measure drainability in production with sub-2ns overhead.
Quick Integration
Four API calls instrument your allocator:
| |
Example: Epoch-Based Allocator
| |
What You Get
After running for a few hours:
| |
Output:
Total epochs closed:     10000
Drainable epochs:        8500
Pinned epochs:           1500
DSR:                     85.0%
Peak simultaneous open:  32
What this tells you: 15% of epochs are pinned. If you close 100 epochs/second, that’s 15 retained epochs per second. Over 24 hours: 1.3 million pinned epochs. If each epoch is 64KB, that’s 83GB of retained memory despite all individual objects being properly freed.
Performance: Production-Ready Overhead
The library has two modes with different overhead profiles:
Production Mode
Lock-free atomic operations only. No per-allocation tracking.
| Operation | Latency | Throughput |
|---|---|---|
alloc_register | 1.97 ns | 508 M/s |
alloc_deregister | 1.77 ns | 565 M/s |
Target: < 10ns per operation Result: Exceeded by 5x
This overhead is negligible for production monitoring. A single atomic increment per allocation. No malloc, no locks, no indirection.
Diagnostic Mode
Enables when production monitoring shows low DSR. Captures source locations for root-cause analysis.
| Operation | Latency | Throughput |
|---|---|---|
alloc_register_located | 24.68 ns | 40.5 M/s |
alloc_deregister | 20.50 ns | 48.8 M/s |
Target: < 50ns per operation Result: Within budget
10x slower than production mode due to per-allocation tracking, but acceptable for investigation. You don’t run diagnostic mode in production - you enable it when production metrics show a problem.
1.97ns overhead] prodmetric[DSR Metric] end subgraph diag["Diagnostic: On Demand"] diagmode[Per-Allocation Tracking
24.68ns overhead] diagreport[Pinning Reports
Source Locations] end prodmon --> prodmetric prodmetric -->|DSR drops below threshold| diagmode diagmode --> diagreport diagreport -->|Fix identified| prodmon style prod fill:#3A4A5C,stroke:#6b7280,color:#f0f0f0 style diag fill:#4C4538,stroke:#6b7280,color:#f0f0f0
Diagnostic Mode: Finding the Root Cause
When production monitoring shows DSR dropping, enable diagnostic mode to identify which allocations are pinning granules.
Enabling Diagnostic Mode
| |
Capturing Source Locations
Use the macro form to capture __FILE__ and __LINE__:
| |
Reading Pinning Reports
When a granule closes with live allocations, a pinning report is generated:
| |
Example Output:
Epoch 1047 PINNED:
  Total allocations: 2
  Freed before close: 1
  Still live (pinning): 1
    [0] src/session.c:84 - 2048 bytes
Now you know exactly where to look: line 84 of session.c is allocating something that outlives the epoch boundary.
Aggregating by Source Location
For large-scale analysis, aggregate reports by allocation site:
| |
Example Output:
Pinning allocations grouped by source location:
  src/session.c:84
    Pinned 847 epochs
    Total: 847 allocations, 1735424 bytes
  src/connection.c:156
    Pinned 213 epochs
    Total: 213 allocations, 436224 bytes
Root cause identified: Session objects allocated at session.c:84 are outliving epoch boundaries by a large margin. This is your structural leak.
Interpreting DSR in Production
The acceptable DSR depends on your workload characteristics:
Granule Close Rate Matters
- 1 granule/second: DSR of 0.99 means 1 pinned granule per 100 seconds. Over 24 hours: 864 pinned granules.
- 100 granules/second: DSR of 0.99 means 1 pinned granule per second. Over 24 hours: 86,400 pinned granules.
- 10,000 granules/second: DSR of 0.99 means 100 pinned granules per second. Over 24 hours: 8.6 million pinned granules.
If each granule is 64KB:
- 864 pinned granules = 55 MB (probably fine)
- 86,400 pinned granules = 5.5 GB (concerning)
- 8.6M pinned granules = 550 GB (service will OOM)
Service Lifetime Matters
Even DSR = 0.99 accumulates over time:
- Hourly restarts: 1% pinned granules may never cause issues
- Daily restarts: 1% pinned can accumulate to GBs
- Weekly+ uptime: 1% pinned becomes unbounded growth
Comparison with Traditional Leak Detectors
These tools are complementary, not competing. Use both.
| Tool | Detects Unreachable Objects | Detects Structural Leaks | Production Overhead |
|---|---|---|---|
| Valgrind | Yes | No | 20-50x slowdown |
| AddressSanitizer | Yes | No | 2x slowdown |
| LeakSanitizer | Yes | No | Minimal |
| libdrainprof | No | Yes | <2ns per operation |
Why existing tools miss this:
Valgrind, ASan, and LSan track whether allocated memory is reachable from roots (stack, globals, registers). They detect when you call malloc() but never free() the pointer.
Structural leaks are different: every object is properly freed, but the coarse-grained allocator cannot reclaim the backing memory because allocations span granule boundaries.
Example: HTTP Server with Epoch Allocation
| |
Session objects are allocated from the request’s epoch but outlive that epoch by hours. When the epoch closes, it’s pinned by the session object. Valgrind sees no leak since both objects are eventually freed. But the allocator can’t reclaim the epoch memory even though the request buffer was freed.
libdrainprof catches this: DSR drops from 1.0 to 0.75 over the first hour of traffic. Diagnostic mode shows session.c:156 is pinning epochs. Fix: allocate sessions from a separate long-lived arena. After the fix, DSR returns to 0.99+ and memory stabilizes.
When to Use This
You need libdrainprof if:
- You use epoch-based reclamation, arena allocators, or slab pools
- Memory grows over time but Valgrind shows no leaks
- You suspect objects are outliving their intended granule boundaries
- You need production-safe monitoring with <2ns overhead
- You want to quantify structural leak severity with a single metric (DSR)
You don’t need this if:
- You use only
malloc/free(traditional leak detectors work fine) - Your allocator reclaims memory per-object, not per-granule
- You don’t have long-running services (structural leaks accumulate over time)
The Formal Result
I formalized when coarse-grained reclamation produces bounded retention:
Theorem 1 (Alignment Theorem): A granule is reclaimable at its boundary if and only if it is drainable. This establishes drainability as both necessary and sufficient.
Theorem 2 (Bounded Growth): If all closed granules are drainable, retained memory R(t) = O(1) - bounded by a constant independent of uptime.
Theorem 3 (Pinning Growth): If fraction p > 0 of granules are non-drainable, then R(t) ≥ p·m(t) = Ω(t) - linear growth with number of reclamation cycles.
The dichotomy: Either O(1) or Ω(t). No intermediate regime. The routing function alone determines which class.
The DSR metric (drainable_closes / total_closes = 1 - p) quantifies this directly. The library validates empirically: P-sweep tests with p ∈ {0.0, 0.01, 0.05, 0.10, 0.25, 0.50, 1.0} confirm the predicted growth rates with R² ≥ 0.998.
RSS over time for seven violation fractions. p=0 is flat, everything else diverges linearly. Even small violation rates cause unbounded growth in long-running services.
For the full proof: See the paper Drainability: When Coarse-Grained Memory Reclamation Produces Bounded Retention (17 pages, includes formal theorems and proofs).
For practical usage: Just use the tool. The math is there if you want it, but the library works whether you read the paper or not.
Summary
Coarse-grained allocators exhibit a binary asymptotic outcome: either O(1) retention (bounded) or Ω(t) growth (unbounded). The routing function alone determines which class. No tuning, no middle ground. This is a structural property, not a fragmentation problem.
Structural memory leaks occur when coarse-grained allocators cannot reclaim memory at granule boundaries despite individual objects being properly freed. Traditional leak detectors miss this because they only track unreachable objects.
Drainability is the necessary and sufficient condition for bounded retention. The DSR metric quantifies this: DSR = drainable_closes / total_closes. When DSR drops below 1.0, you have structural leaks accumulating at Ω(t).
libdrainprof makes drainability measurable in production with <2ns overhead (production mode) or 25ns overhead (diagnostic mode). Integration requires four API calls. The library captures source locations and generates pinning reports showing which allocations prevent reclamation.
Workflow: Run production mode always-on to monitor DSR. When it drops, enable diagnostic mode temporarily to identify problematic allocation sites. Fix the lifetime mismatches. Return to production monitoring.
For the theory: Read the paper (formal proofs, theorems, empirical validation).
For practical debugging: Use the tool. The math validates the approach, but the library works whether you read the paper or not.
Project: https://github.com/blackwell-systems/drainability-profiler Paper: https://doi.org/10.5281/zenodo.18653776 License: MIT
📚 Series: Structural Leaks
- Structural Memory Leaks: Binary Outcomes in Coarse-Grained Reclamation (current)
- Catching Structural Memory Leaks: A Temporal-Slab Case Study
- Instrumenting Redis for Structural Leak Detection: A jemalloc Deep Dive